- Products

- Developers
- User stories
- Blog
- Pricing

Memory profiling in Haskell

At Pusher we are currently writing a high performance system in Haskell and blogging about it along the way. In our first blog post we explained some tools and tips that we have used for improving CPU time of our program. We’ve received requests for part two, so here it is. In this post we’re \[…\]
Introduction
At Pusher we are currently writing a high performance system in Haskell and blogging about it along the way. In our first blog post we explained some tools and tips that we have used for improving CPU time of our program.
We’ve received requests for part two, so here it is. In this post we’re going to look at memory usage and the garbage collector. Why? To track down memory leaks (using GHCs heap profiling and ThreadScope).
First things first, why do we do space (heap) profiling?
Tracking down memory leaks
Haskell is lazily evaluated. This means that expressions are not evaluated when they are bound – not where they are in your source code – but when they are being used, for example as an argument to an IO action.
This is great because it lets you write code that matches the algorithm you are focusing on, without needing to manage the details of how it is exactly executed. It can often let you write code that is both high level, and also very performant; we will cover this in more detail later in this post.
However laziness can make it harder to reason the memory usage of your application, thus making memory leaks a common problem.
This page provides a classic example of how laziness in the accumulator of an innocent looking fold can lead to a very large memory footprint.
In practice we have found memory leaks most frequently occur in multi-threaded environments where a series of updates to a shared mutable variable were stored, but never actually executed i.e. if the reading thread was not running for some reason.
Improving performance
As well as fixing memory leaks, you may also want to look at memory usage in order to improve your program’s performance in general.
Because Haskell is a garbage collected language, the more data you create, the more work the runtime system has to perform in order to clean up. So if you are not using memory efficiently, or creating more data than you need to, then both the throughput and latency of your program can suffer.
The Haskell GC is generational; that is, data is initially created in a “nursery” (generation 0), which is fast, small, and collected frequently. When the GC collects data from the nursery, any data still around is copied to generation 1, which is larger and collected less frequently.
By default there are two generations, although this can be tuned. Haskell’s GC is “stop the world” so no work can be performed on any other program threads while the GC is running. This means that during large generation 1 garbage collections the delays can be in the tens or hundreds of milliseconds, something we’d obviously like to avoid.
Inspecting the heap
The Real World Haskell book already has a good tutorial on this topic, but I will explain the overall idea here.
Haskell’s profiling system provides great tools for inspecting the state of the heap (where objects are stored) over time.
First you need to build your program with the flags
1-rtsopts -prof
and then run your program with +RTS and then one of the flags listed here. This will generate a file called your-executable.hp. You can render the data into a PostScript graph with the command hp2ps -e8in -c your-executable.hp. Below is a classic example of the kind of output you will see when using the -hc flag on a program with a memory leak.
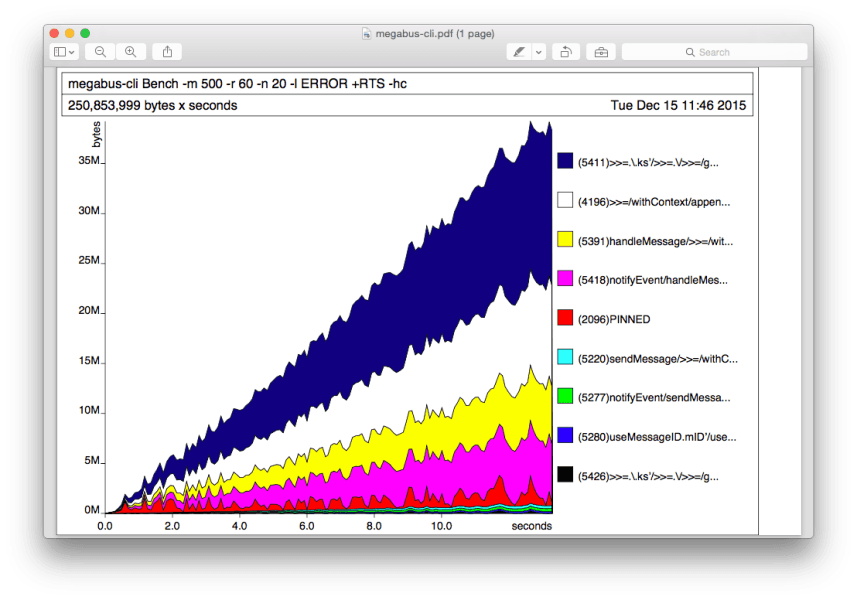
We found the best flag to choose depends on the problem you want to solve.
If you think you are generating more data than you expected to, then you most likely want to know which function is producing the data, and what the data is that is being produced. We find the -hc option useful for the former, and -hd (showing the data constructor) useful for the latter.
When tracking down a memory leak, the two options described above will be useful if you are not clear on where the leak is occurring. Once you know what data is being created, you will want to know why it is not being garbage collected.
Heap objects can only be collected when no other objects are referencing them. If you have a leak then an object must still be holding a reference to the data you were expecting to be collected. We found the -hr option useful for this. In addition to the .hp file, it will also generate .prof file. Essentially, for each heap object you will see the set of objects that have a reference to it.
Inspecting the GC
ThreadScope is a great tool in gaining some insight into what the GC is doing. This will visually show exactly when and for how long the GC is run. In particular it can be a useful way of spotting the expensive generation >= 1 GCs.
The output will look something like this:
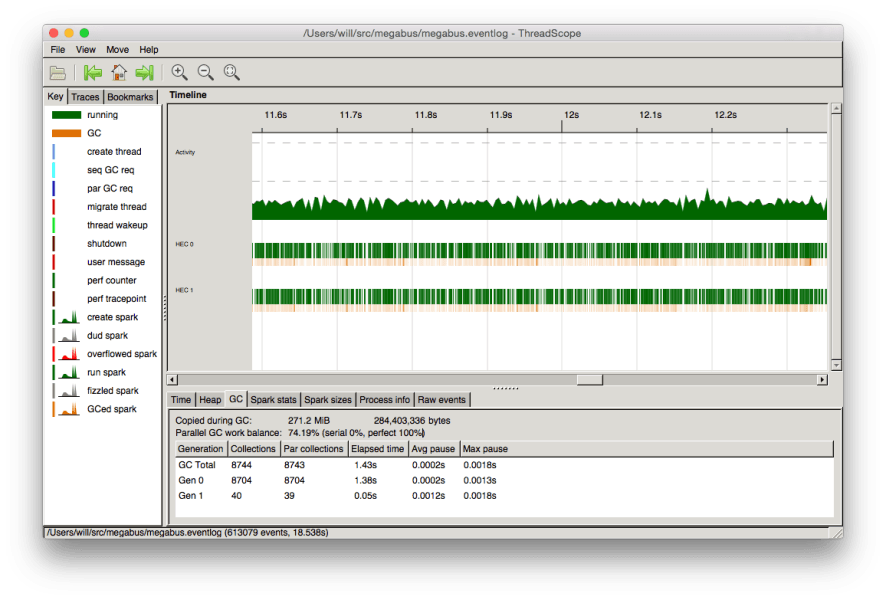
A lot of this information can also be gained from running with the RTS flags. -s provides a summary of information that will likely be useful even before heap profiling. -S will output very detailed information about every collection. More detailed information on these can be found here.
The various parameters that dictate how and when the GC is run can be tweaked, and this might be enough to overcome GC issues you may have identified; these options are listed here. Simon Marlow (one of the GHC co-developers) described some heuristics that can be used when selecting these.
You can also try using ghc-gc-tune which will run your program multiple times with different options in order to automatically detect the best performing combination.
So now you’ve got to grips with identifying memory leaks and tuning the GC, what’s next?
In part three I’ll be looking at a number of techniques and libraries we have found that can maximise memory efficiency when writing performance critical code.
Think I’ve missed anything here or would you like to know more about anything outlined above? Leave a comment below or find me on Twitter @willsewell_.


© 2024 Pusher Ltd. All rights reserved.
Pusher Limited is a company registered in England and Wales (No. 07489873) whose registered office is at MessageBird UK Limited, 3 More London Riverside, 4th Floor, London, United Kingdom, SE1 2AQ.